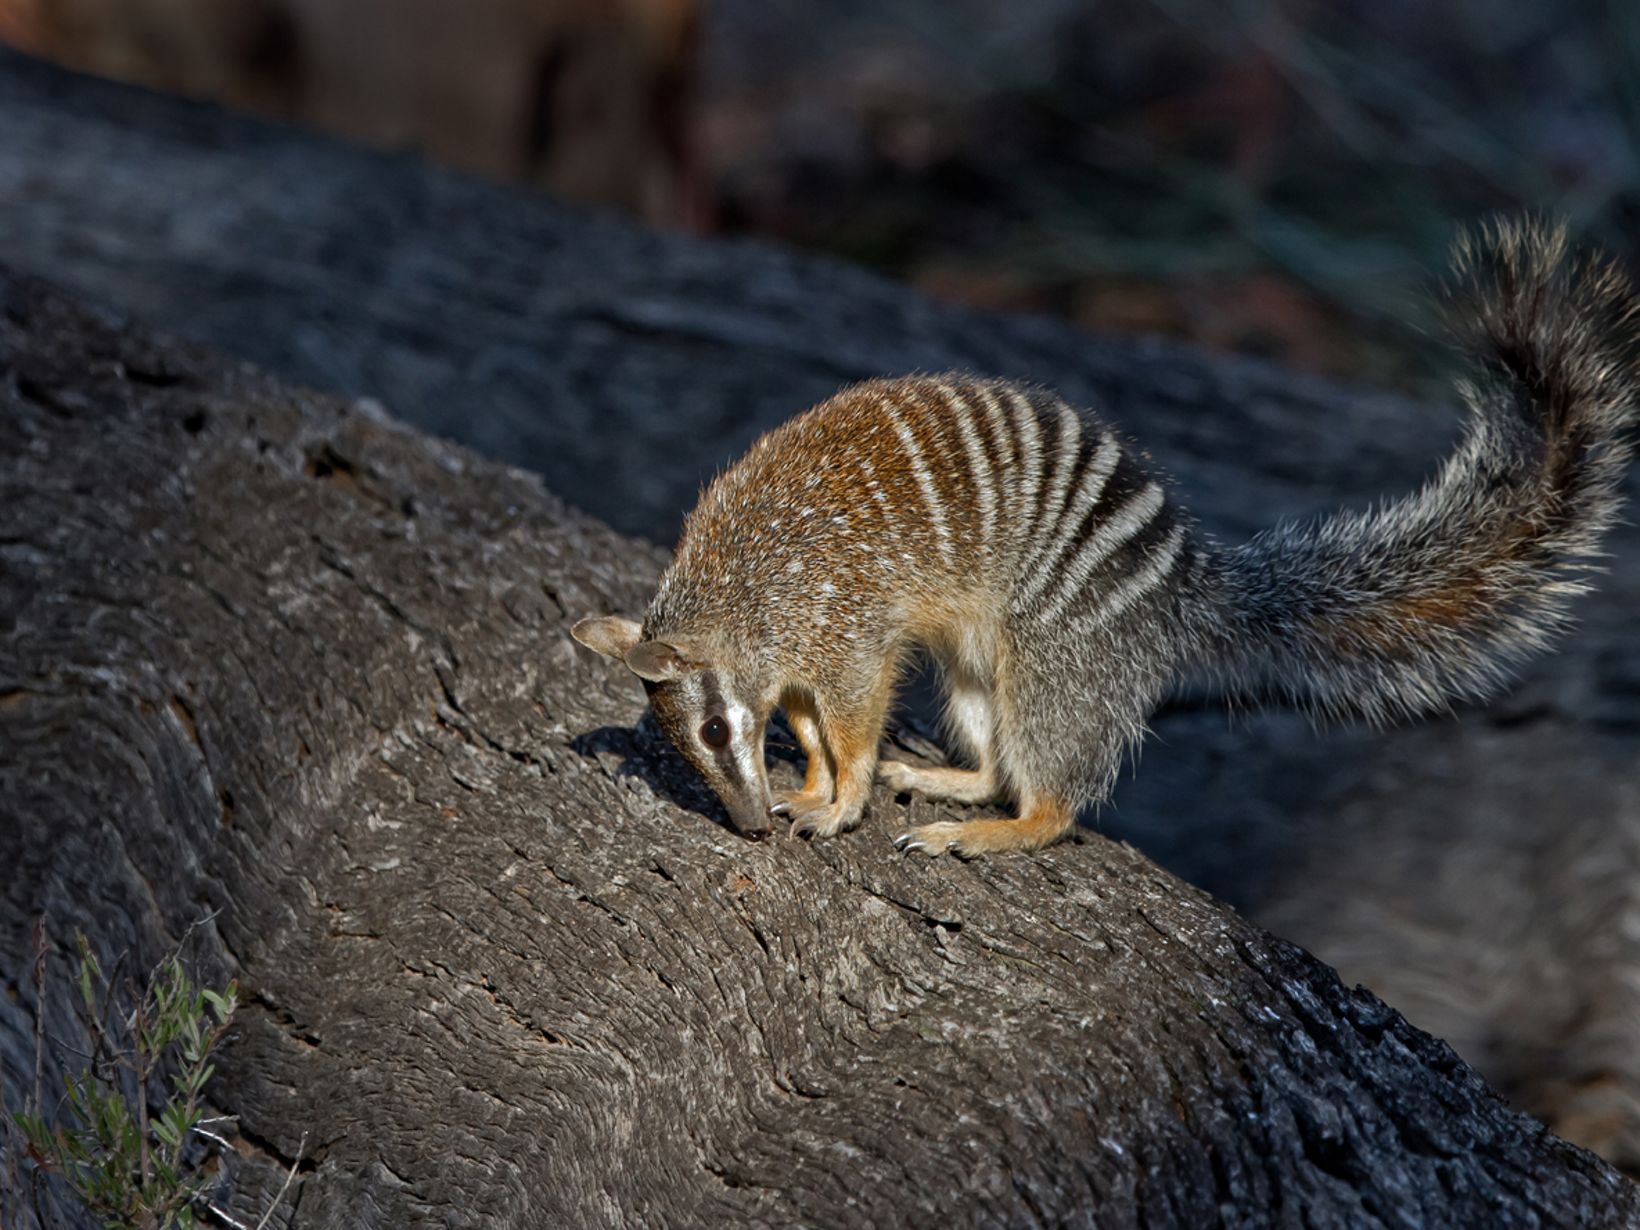
This is the Numbat. Numbat is currently known to exist in the woodlands of Western Australia. They prefer areas with dense vegetation, and since they are also known as anteaters, they have an appetite for termites. Numbats are on the verge of extinction due to habitat loss, predation by invasive species, and other threats. Their population is limited to several isolated areas, and they might not exist in the next few decades.
Read more about Numbats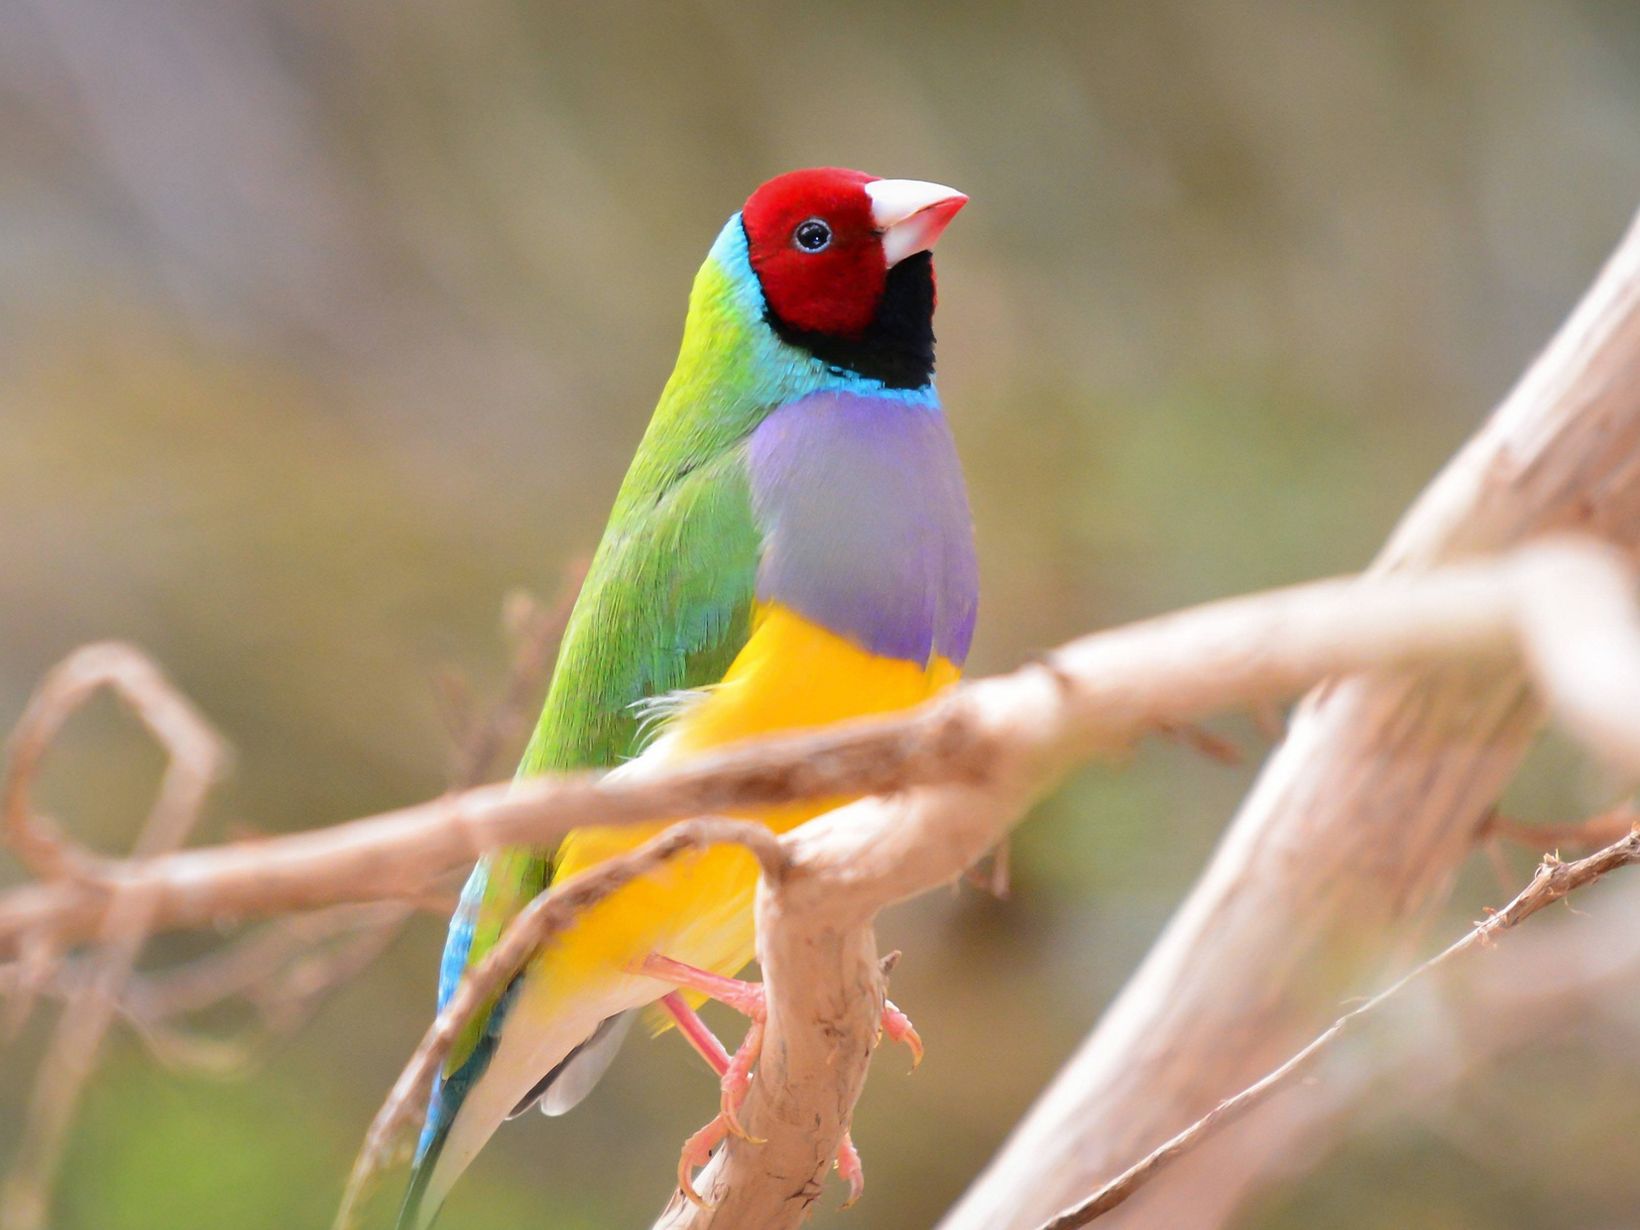
Gouldian Finch is a small bird that has many different colours of feathers. However, because of their pretty colours, they were once the target of poachers and the likes. As such, their population has declined significantly, and their survival is under threat, due to habitat changes through forest fires and the likes.
Read more about Gouldian Finches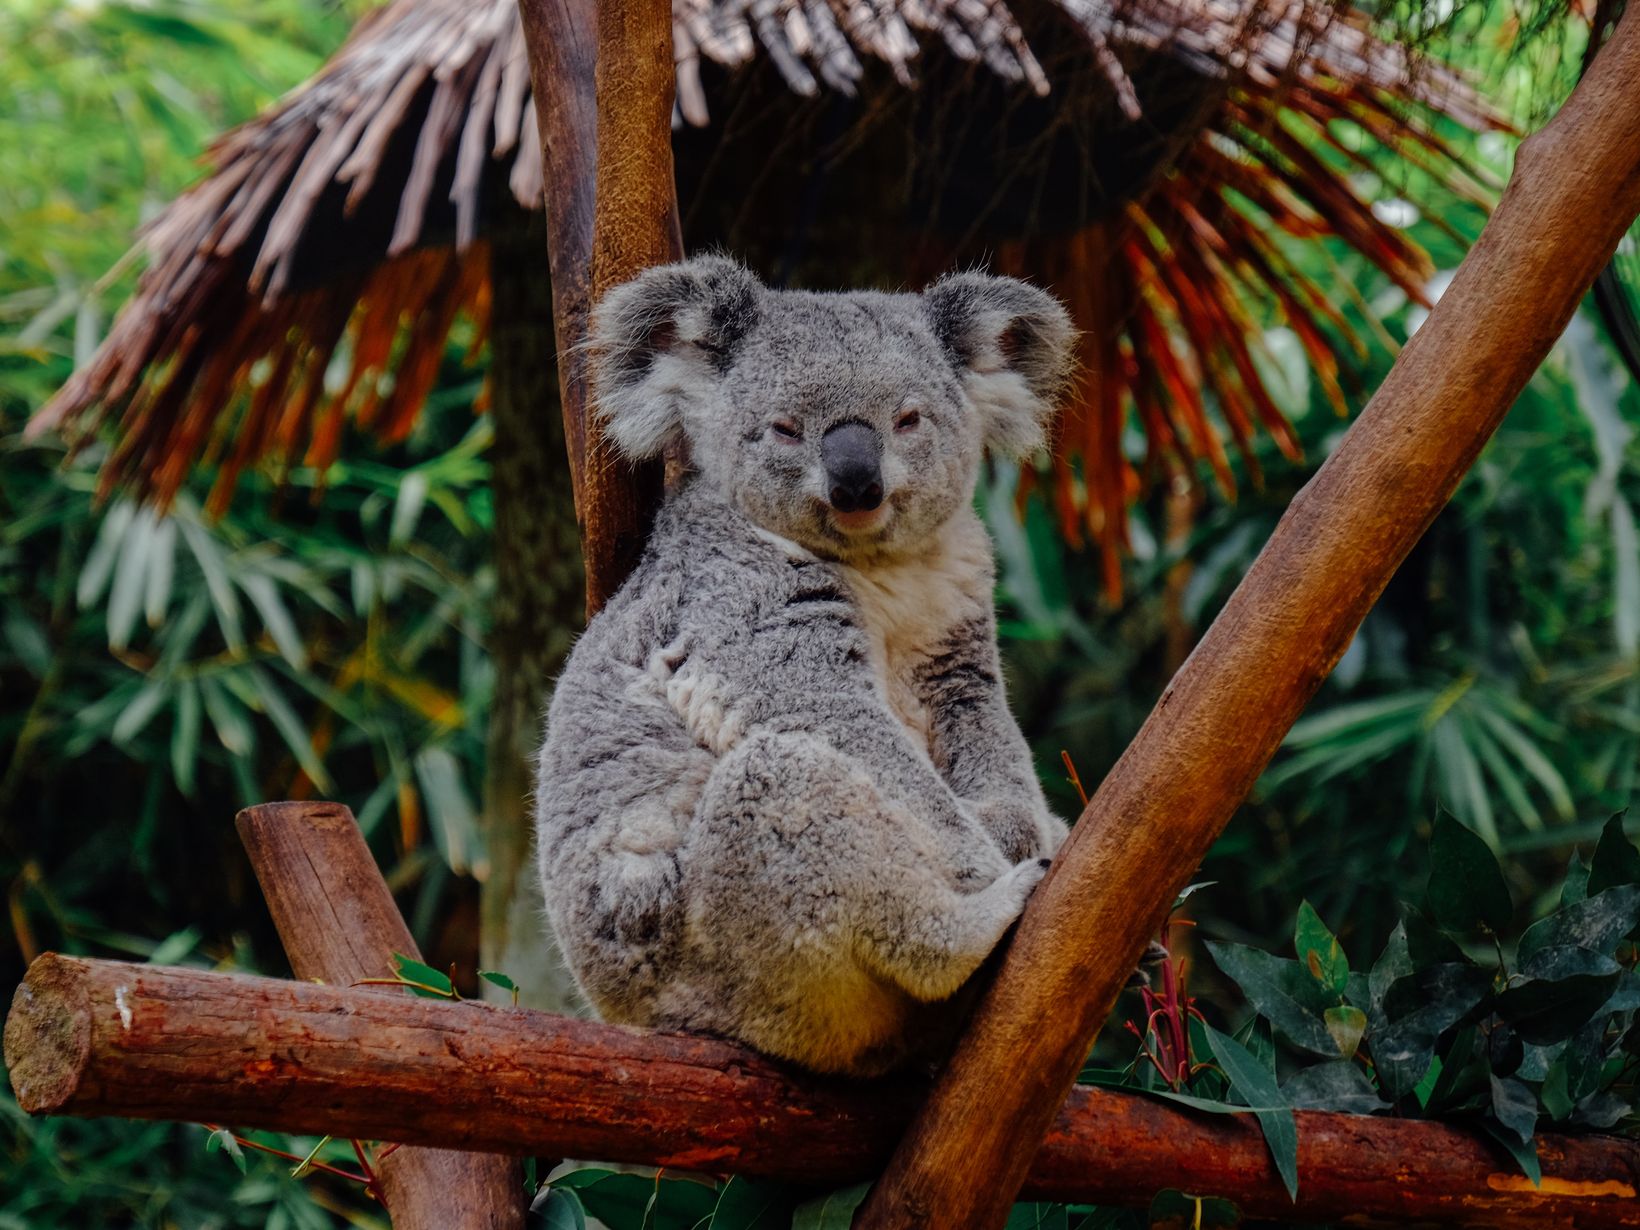
Koalas are one of the worlds most notable marsupials that can only be found in Australia. They are often thought to be bears, but they are actually not. Their diet primarily consists of eucalyptus tree leaves, and as such, they dwell on these trees most of the time. They are known to be sedentary, and they spend most of their time sleeping, moving only when it is necessary. Koalas are under the threat of extinction, due to habitat loss and climate change. Deforestation has affected their limited spread, and when combined with a lot of different climactic factors, their survival in the coming decades are under the watchful eyes of conservationists.
Read more about Koalas